Prop firm calculators
Prop firm calculators that work out your pass probability, drawdown floor, payouts and evaluation cost. Enter your own rules, or load the preset for FTMO, Topstep, Apex, Earn2Trade or The5ers. Free, no signup.
freeno signupruns in your browser
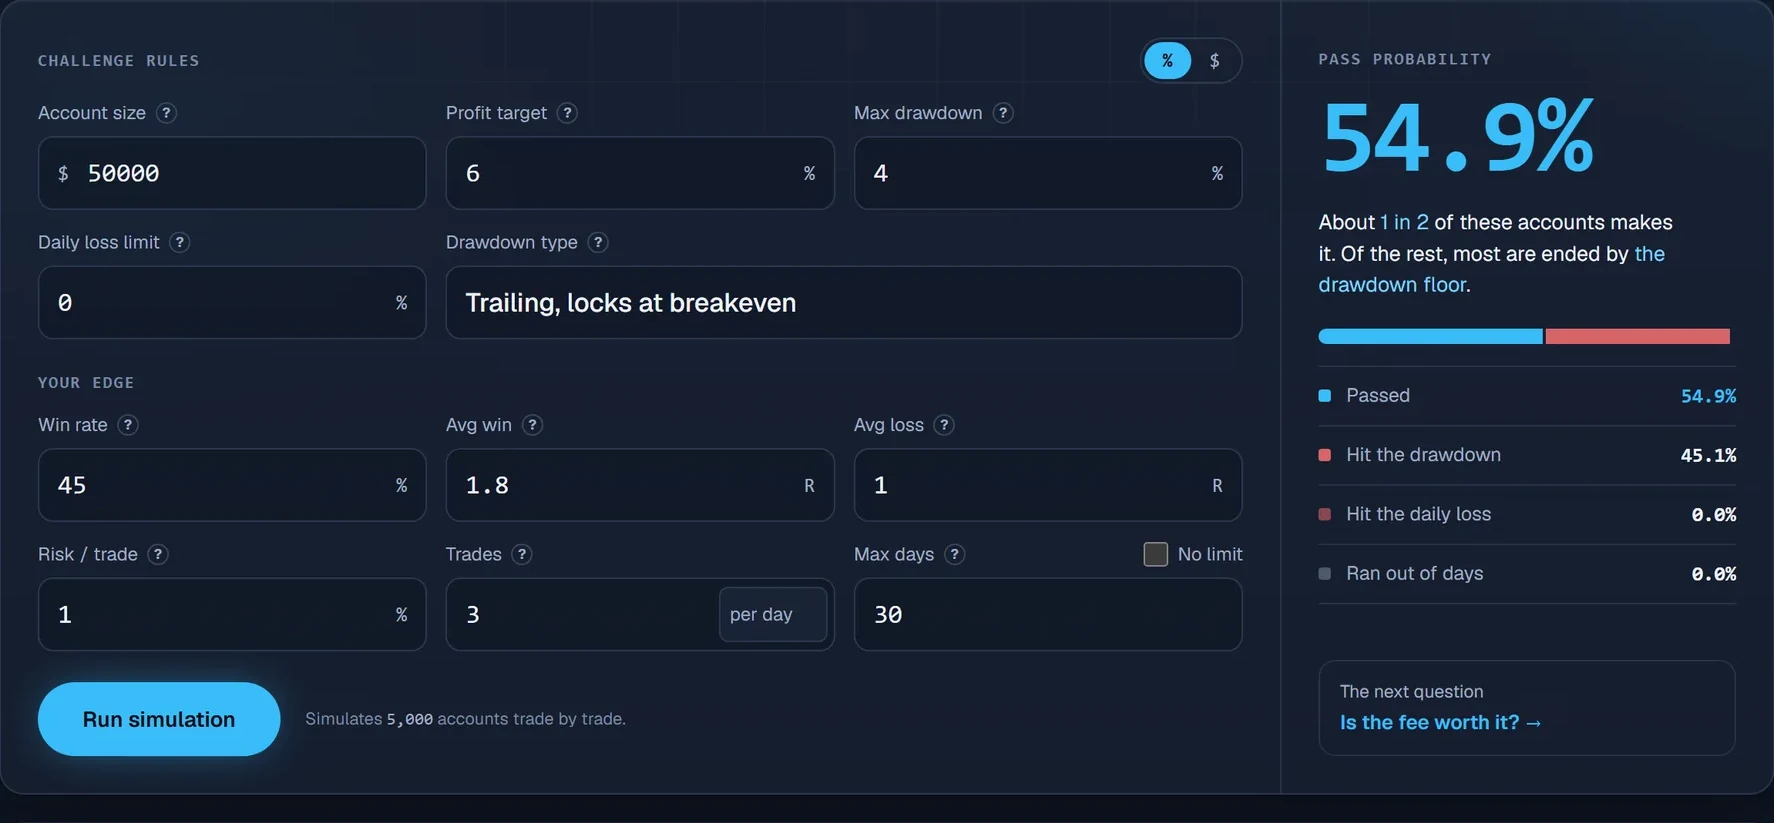
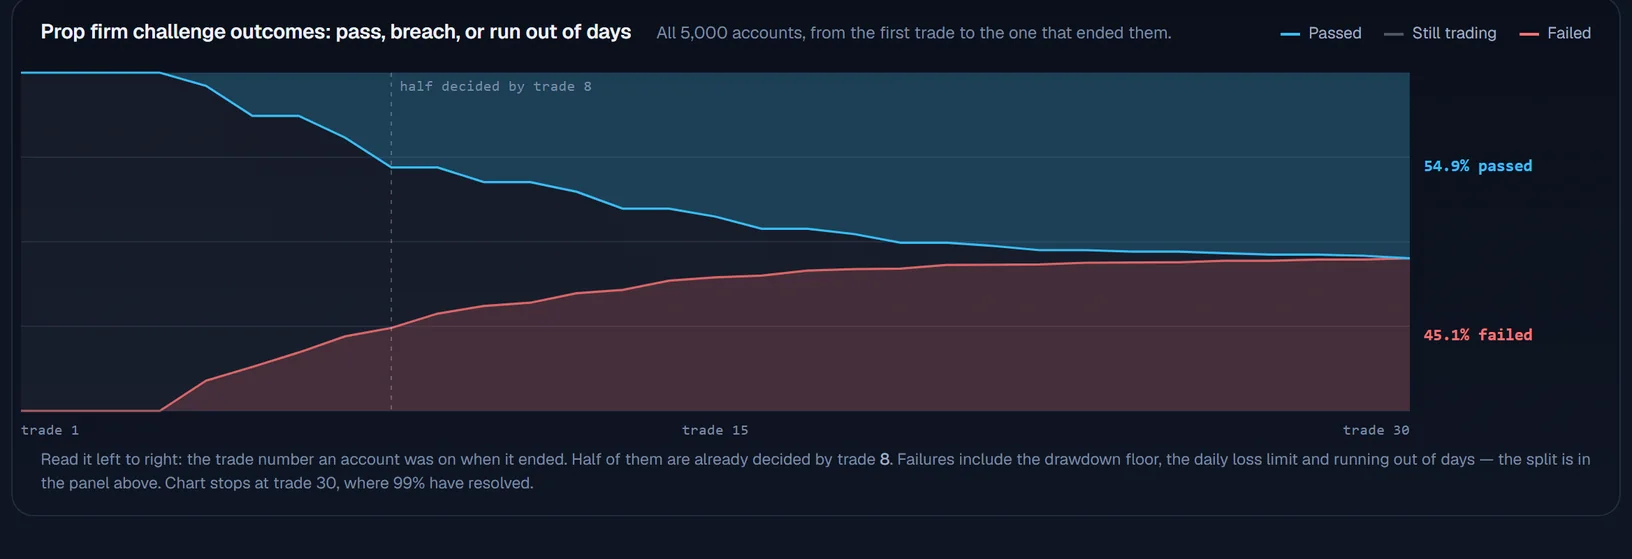
The prop firm challenge simulator returns your pass probability from 5,000 runs
Your win rate does not decide this. A challenge is a race between a profit target and three things that can end it early: the drawdown floor, the daily loss limit and the clock.
Every one of those runs uses your own firm's rules, so the probability is yours rather than an average.
Prop firm challenge calculator Variance calculator Expectancy calculator
The drawdown calculator gives the exact dollar level you cannot trade below
Some firms fix that floor once. Most move it up behind you as you make money, so it does not matter how great a week you had, you still have the room you started with.
Drawdown calculator Static End of day trailing Intraday trailing Risk per trade Tick value
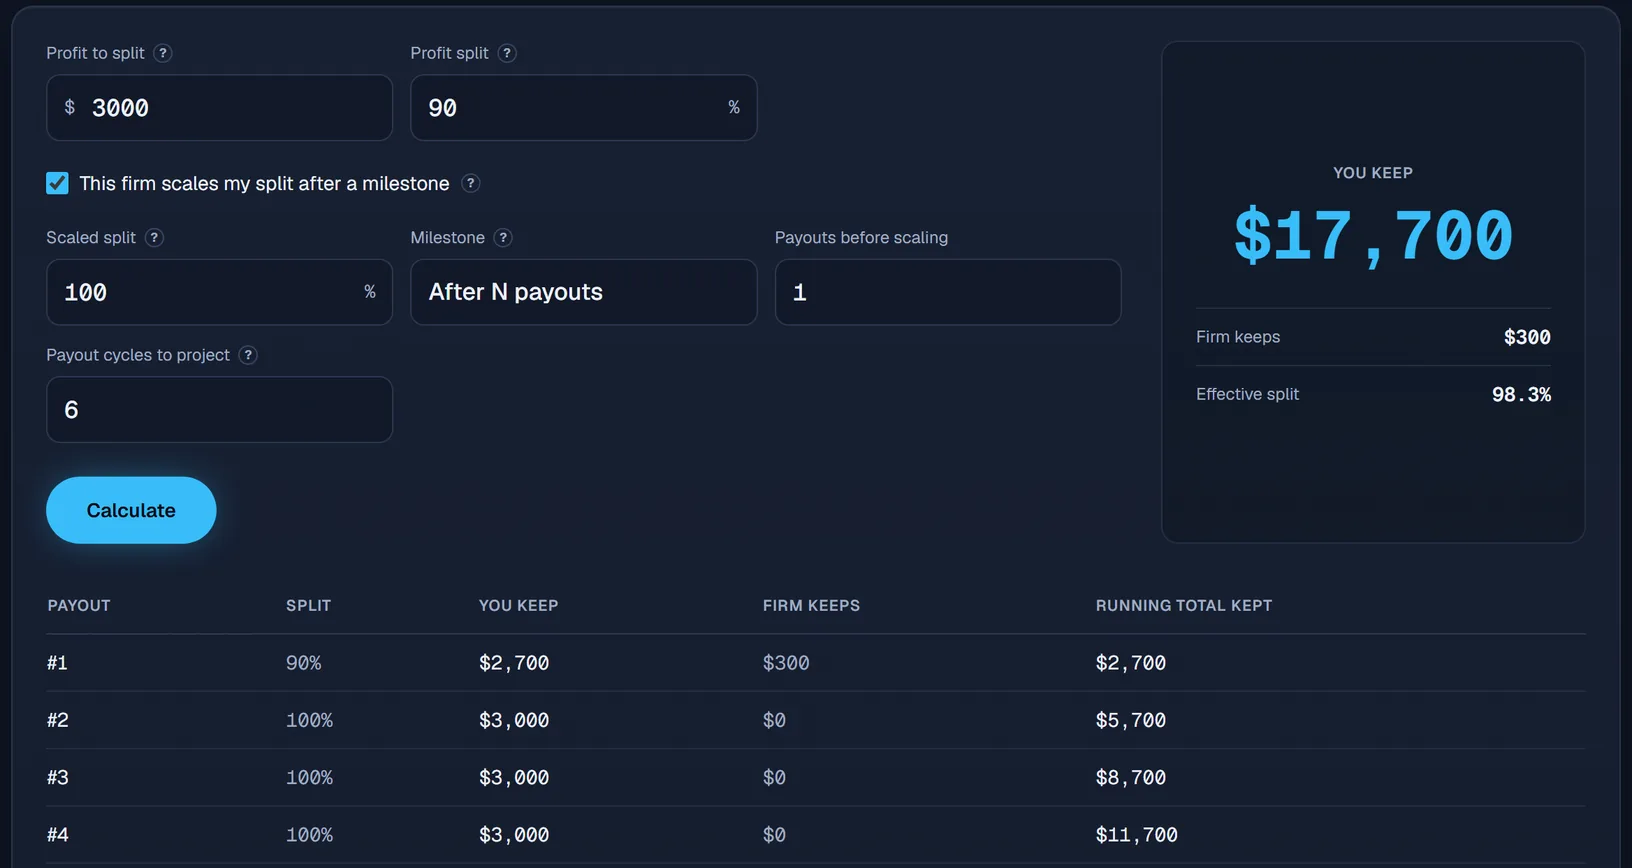
The payout calculator shows what reaches your bank after the split
The profit on your screen is not the money you receive.
The firm keeps its share, and the payout rules (minimum days, how often you can withdraw, and a cap on how much of your profit one big day may be) decide when the rest reaches you.
Payout calculator Consistency rule calculator Earnings calculator
The evaluation cost calculator prices the resets, activation and monthly fees
Almost nobody passes first time, and no trader passes every time. The real cost is the attempts you buy, not the checkout price.
Weigh that total against what a payout is worth to you.
Five rule sets compared: FTMO, Topstep, Apex, Earn2Trade, The5ers
Firms differ far more than their marketing suggests, and the difference that matters most is how the drawdown behaves.
Common prop firm calculator questions
Are these prop firm calculators free?
Yes, all of them. Every calculator runs in your browser, there is no signup and no email, and nothing you type is stored or sent anywhere.
Which firms are the calculators preloaded with?
FTMO, Topstep, Apex, Earn2Trade and The5ers. Loading a preset fills the rule fields with that firm’s published numbers, read from its own program cards and help center — always confirm them against your own account before you trade, because firms change programs without much notice.
What is the difference between a static and a trailing drawdown?
A static floor is set once when the account opens and never moves. A trailing floor follows your balance up as you make money, which is why a profitable week can leave you with the same room you started with. Some firms stop the trail once it reaches your starting balance; others trail intraday, off your open position rather than your closed day, which is stricter again.
Can a calculator tell me whether I will pass?
No, and anybody promising otherwise is probably trying to sell you something. What the challenge simulator gives you is a probability: it deals your account 5,000 times under your firm’s actual rules and counts how many get to the target before the drawdown, the daily loss limit or the clock ends them.
Every firm rule here is read from that firm's own help center
- FTMO, Topstep, Earn2Trade and The5ers were verified by hand, firm by firm.
- Built and maintained by one working trader, not a content team.
- No signup, no email, nothing you type is stored or sent anywhere.